
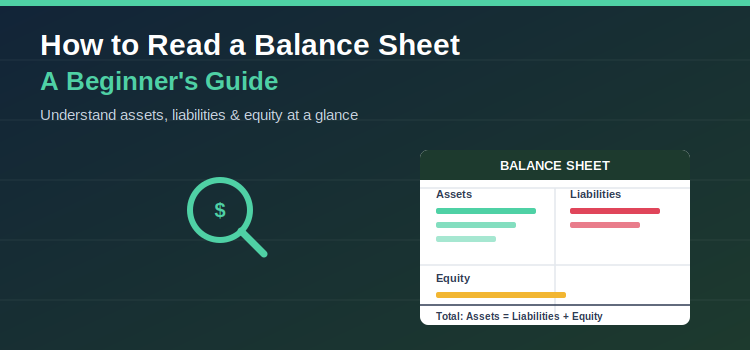
A balance sheet is a snapshot of a business’s financial position on one specific date. It has three sections assets (what the business owns), liabilities (what it owes), and equity (what’s left over for the owners), and they always follow one formula: Assets = Liabilities + Equity. To read one as a beginner, check that it balances, scan cash and debt first, compare current assets to current liabilities (the current ratio), and look at the trend over several periods rather than a single snapshot.
What Is a Balance Sheet, Really?
Think of a balance sheet as a financial photograph, not a video. Unlike an income statement, which covers a period of time a month, quarter, or year a balance sheet is always dated to a single day, like “As of December 31, 2026.” It freezes the business in place and answers three questions:
- What does the business own? (Assets)
- What does the business owe? (Liabilities)
- What’s left for the owners after debts are paid? (Equity)
Every balance sheet in the world, from a solo freelancer’s spreadsheet to Apple’s quarterly filing, is built on the same accounting equation:
Assets = Liabilities + Equity
In plain English: everything a company owns was paid for either with borrowed money (liabilities) or with the owners’ own money and retained profits (equity). There’s no third option. If the two sides don’t match, something in the books is wrong the equation should always hold true, and checking that it balances is the very first thing to do before trusting any other number on the page.
The Three Sections of a Balance Sheet
1. Assets — What the Business Owns
Assets are everything with value that the business controls, and they’re listed in order of liquidity how quickly each one can be turned into cash.
Current assets (expected to convert to cash within 12 months):
- Cash and cash equivalents
- Accounts receivable (money customers owe you)
- Inventory
- Short-term investments or marketable securities
- Prepaid expenses
Non-current (long-term) assets (held for more than a year):
- Property, plant, and equipment (buildings, machinery, vehicles)
- Long-term investments
- Intangible assets (patents, trademarks, goodwill)
A bigger asset total doesn’t automatically mean a healthier business it only tells you the company’s financial size. The real insight comes from what those assets actually are and how liquid they are.
2. Liabilities — What the Business Owes
Liabilities are obligations the business will need to pay in the future, and like assets they’re split by timeframe.
Current liabilities (due within 12 months):
- Accounts payable (unpaid bills to vendors)
- Short-term loans or the current portion of long-term debt
- Accrued expenses (wages, taxes owed but not yet paid)
- Unearned revenue
Non-current (long-term) liabilities (due beyond 12 months):
- Long-term loans and mortgages
- Bonds payable
- Deferred tax liabilities
- Lease obligations
3. Equity — What’s Left for the Owners
Equity is the residual value: what would be left over if the business sold all its assets and paid off every liability. For a small business, this usually includes:
- Owner’s capital or common stock
- Retained earnings (accumulated profit kept in the business rather than distributed)
- Additional paid-in capital (for businesses with outside investors)
If equity is shrinking or negative over time, it’s often a signal that the business is losing money faster than it’s bringing new capital in.
A Simple Example
Say you run a small landscaping business. Here’s a simplified snapshot:
Assets: $12,000 cash + $8,000 owed by clients (accounts receivable) + a $35,000 truck = $55,000 total assets
Liabilities: $20,000 remaining on the truck loan + $3,000 on a business credit card = $23,000 total liabilities
Equity: $55,000 − $23,000 = $32,000 owner’s equity
That $32,000 is your actual stake in the business what would be left in your pocket if you sold the truck, collected everything owed to you, and paid off every debt today.
Five Things to Check When You Read a Balance Sheet
You don’t need an accounting degree to get real insight from a balance sheet. Focus on these five things.
1. Does It Actually Balance?
Confirm total assets equal total liabilities plus equity. Published financial statements from reputable sources should always balance; if a statement you’re reviewing doesn’t (accounting for rounding), that’s a red flag that something was recorded incorrectly.
2. The Current Ratio (Can It Cover Short-Term Bills?)
Current Ratio = Current Assets ÷ Current Liabilities
This tells you whether the business has enough short-term assets to cover what it owes in the next 12 months. A current ratio around 1.5–2.0 is generally considered healthy for most small businesses enough cushion without excess idle cash. A ratio well below 1.0 can signal a looming cash crunch; a ratio far above 2.0 might mean cash is sitting idle instead of being reinvested.
3. The Quick Ratio (A Stricter Cash Test)
Quick Ratio = (Current Assets − Inventory) ÷ Current Liabilities
This strips out inventory, which isn’t always quick to sell, giving a more conservative view of whether near-term obligations can be met with truly liquid assets.
4. The Debt-to-Equity Ratio (How Leveraged Is the Business?)
Debt-to-Equity Ratio = Total Liabilities ÷ Total Equity
This shows how much of the business is financed by debt versus owner investment. A high ratio means the business relies heavily on borrowed money, which can amplify both returns and risk lenders and investors often use this ratio to judge how leveraged, and how risky, a business is.
5. Working Capital (The Cushion Between Assets and Bills Due Soon)
Working Capital = Current Assets − Current Liabilities
Positive working capital means the business has more short-term resources than short-term obligations a buffer for day-to-day operations. Negative working capital is worth investigating; it doesn’t always spell trouble, but it means near-term bills exceed near-term liquid resources.
Common Beginner Mistakes to Avoid
- Reading it in isolation. A single balance sheet is a snapshot; the real story comes from comparing several periods to spot trends is debt climbing? Is equity growing?
- Assuming bigger always means better. Total asset size reflects scale, not necessarily financial health.
- Ignoring reconciliation. If cash and credit card accounts aren’t reconciled behind the scenes, a balance sheet can show “phantom cash” or hide real liabilities the numbers only mean something if the underlying bookkeeping is accurate.
- Looking at the balance sheet alone. Pair it with the income statement (profitability over a period) and the cash flow statement (how cash actually moved) for a complete financial picture the balance sheet won’t tell you whether last month was profitable or where revenue came from.
Balance Sheet vs. Income Statement vs. Cash Flow Statement
| Balance Sheet | Income Statement | Cash Flow Statement | |
|---|---|---|---|
| What it shows | Financial position at a point in time | Profitability over a period | Cash movement over a period |
| Key question answered | What do we own and owe? | Did we make money? | Where did our cash actually go? |
| Time frame | Single date (snapshot) | Period (month, quarter, year) | Period (month, quarter, year) |
| Core formula | Assets = Liabilities + Equity | Revenue − Expenses = Net Income | Operating + Investing + Financing cash flows |
A balance sheet isn’t just a compliance document it’s one of the fastest ways to answer the questions that actually matter to a business owner: Can I cover the next 90 days? Am I carrying too much debt? Is my equity growing or shrinking? Learning to read assets, liabilities, and equity and running a few simple ratios like the current ratio and debt-to-equity ratio turns a page of numbers into a genuine diagnostic tool for the health of the business.
Why Professional Accounting Solutions Matter Here
A balance sheet is only as trustworthy as the bookkeeping behind it. Unreconciled bank accounts, misclassified transactions, or inconsistent recording can make even a perfectly balanced statement misleading showing cash that isn’t really available or hiding liabilities that are about to come due. This is where professional accounting solutions earn their value: a qualified bookkeeper keeps the underlying data clean and reconciled month to month, while an accountant or CPA can interpret the resulting balance sheet, calculate the ratios that matter for your industry, and flag warning signs shrinking equity, a weakening current ratio, rising leverage long before they become a crisis. Cloud accounting platforms like QuickBooks Online and Xero can generate a balance sheet in seconds, but generating the report and understanding what it’s telling you are two different skills. For small business owners who want to use their balance sheet to make real decisions securing financing, planning for growth, or simply sleeping better at night pairing good software with professional bookkeeping and accounting support is what turns a static financial statement into a genuinely useful management tool.
Leave A Comment